Get In Touch
Until April 2025, if you wanted something more sophisticated than a mutual fund, your only option was PMS at ₹50 lakh. That was it.
Later, SEBI introduced Specialised Investment Funds, which provide access to advanced strategies such as long-short equity and derivatives within the mutual fund framework – for just ₹10 lakh. Suddenly, two products are competing for the same investor.
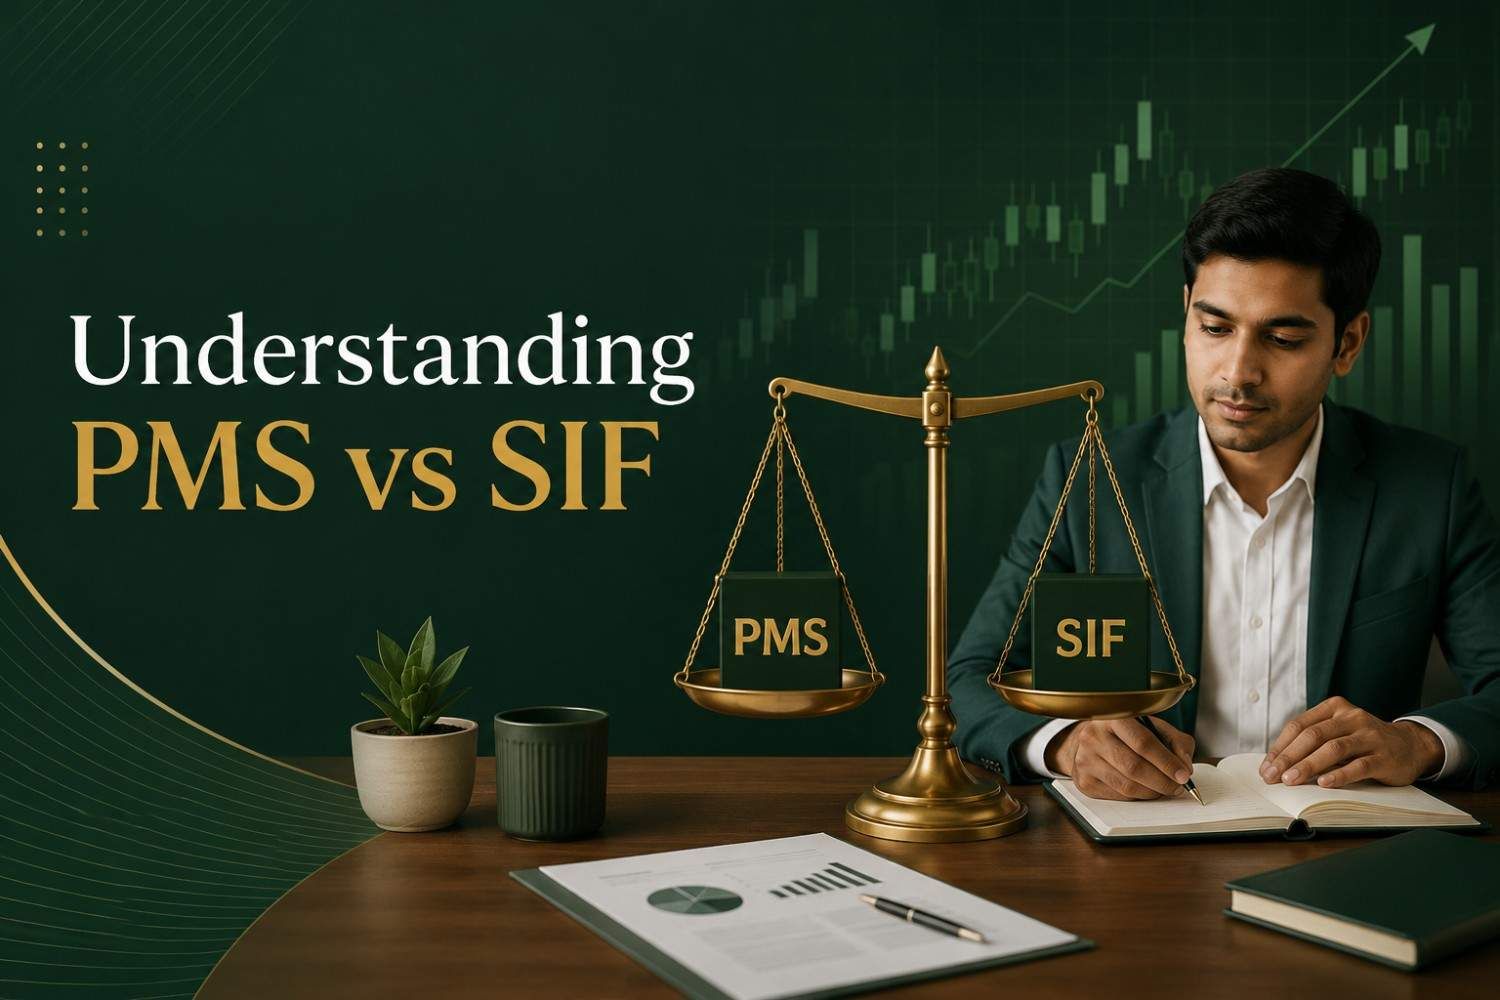
So, the question is, “Is SIF a shorter version of PMS? If not, how does it differ?”
To get answers to your questions, read this guide that compares PMS and SIF across structure, ownership, fees, taxation, and risk.
PMS (Portfolio Management Services) is a SEBI-regulated service where a portfolio fund manager builds a customised stock portfolio and manages the same.
Here, the minimum investment in PMS is ₹50 lakh with stocks held directly in your demat account with full transparency on every holding and trade.
Key features of PMS include:
The SEBI-mandated minimum has moved from ₹5 lakh (1993) → ₹25 lakh (2012) → ₹50 lakh (2020, current).
A SIF (Specialised Investment Fund) is a SEBI-regulated pooled investment product under the mutual fund framework, effective April 2025, that offers advanced strategies such as long-short equity and tactical asset allocation with a ₹10 lakh minimum — without direct stock ownership.
Let us look at this table to understand the core differences between PMS and SIF:
| PMS | SIF | |
| SEBI framework | Portfolio Managers Regulations, 2020 | Mutual fund regulations |
| Minimum investment | ₹50 lakh per PAN | ₹10 lakh per PAN |
| Structure | Separate portfolio in your demat | Pooled (like a mutual fund) |
| Ownership | Direct stocks in your name | Fund units |
| Customisation | Usually follows a model, not always possible. | None – one strategy for all investors |
| Typical holdings | 15–30 stocks, individually held | Strategy-dependent; pooled |
| Derivatives usage | Manager discretion; may not be common practice. | Unhedged short up to 25% NAV |
| Strategies available | Any equity strategy — value, growth, momentum, thematic, etc. | Long-short, sector rotation, hybrid, tactical allocation. |
| Liquidity | Exit takes time. No lock-in, but slower unwinding. | Depends on the SIF fund |
| SIP available? | Some providers allow top-ups after ₹50 lakh initial | Yes, after meeting the ₹10 lakh threshold. |
| NAV disclosure | No NAV — portfolio valued periodically. Communication happens monthly/quarerly/annually. | Daily by 11 PM |
| Who it's for | ₹50 lakh–₹5 crore+ Wants direct ownership + full customisation | ₹10–50 lakh corpus Wants advanced strategies at MF costs. |
SIF operates under mutual fund expense ratio caps, making it structurally cheaper. PMS involves management fees, performance fees, brokerage, custody, and GST.
| PMS | SIF | |
| Management fee | 1–2.5% of AUM | Within the MF expense ratio (1–2%) |
| Performance fee | 10–20% of profits above the hurdle rate | Not applicable (MF structure) |
| Entry/exit load | 1–3% exit load within 1–2 years (provider-dependent) | AMC-defined; typically 0–1% |
| Brokerage | Charged separately per trade | Embedded in the expense ratio |
| GST | 18% GST on management + performance fees | Included in the expense ratio |
For Portfolio Management Services or PMS, the STCG taxation is set at 20% and LTCG (more than 12 months) is 12.5% above ₹1.25L.
Likewise, MF tax rules will apply for SIF as well.
The question between PMS vs SIF, neither is universally "better." They solve different problems at different wealth stages. Mostly, SIFs for diversified, cost-efficient core exposure that aligns with the mutual fund framework.
At the same time, if an investor needs customisation and concentration that pooled products can't provide, SIF can be a good solution.
But, don’t forget to evaluate both the options and invest likewise.
SIP is available in SIF after meeting the ₹10 lakh initial threshold. Some PMS providers allow systematic top-ups after the ₹50 lakh minimum is met, but it's not as structured as mutual fund SIPs.
Disclaimer:
The information provided in this article is for educational and informational purposes only. Any financial figures, calculations, or projections shared are solely intended to illustrate concepts and should not be construed as investment advice. All scenarios mentioned are hypothetical and are used only for explanatory purposes. The content is based on information obtained from credible and publicly available sources. We do not guarantee the completeness, accuracy, or reliability of the data presented. Any references to the performance of indices, stocks, or financial products are purely illustrative and do not represent actual or future results. Actual investor experience may vary. Investors are advised to carefully read the scheme/product offering information document before making any decisions. Readers are advised to consult with a certified financial advisor before making any investment decisions. Neither the author nor the publishing entity shall be held responsible for any loss or liability arising from the use of this information.